WebSocket Dashboard
The WebSocket Dashboard provides a real-time visualization of model metrics and settings via a web browser.
Accessing the Dashboard
The dashboard runs as a built-in HTTP server on port 49223 by default. Open it in your browser:
http://localhost:49223
Enabling in Serve Mode
The dashboard can be enabled in serve mode using the --ws-enable flag:
./build.sh serve --model model.gguf --api-port 49222 --ws-enable
Customize the dashboard port and authentication:
./build.sh serve --model model.gguf --api-port 49222 --ws-enable --ws-port 8081 --ws-auth mykey
Customize the host and use a specific backend binary:
./build.sh serve --model model.gguf --api-port 49222 --ws-enable --host 0.0.0.0 --backend-binary /opt/rocm/bin/llama-server
The --host option controls the bind address for both the API proxy server and the WebSocket dashboard server, ensuring they use the same network interface. The default is 127.0.0.1 (from config).
Enabling in TUI Mode
The dashboard can also be enabled from the TUI:
- Open the Server Settings panel (F2)
- Navigate to Dashboard and press
Enter - Configure:
- Enabled — toggle on/off
- Port — server port (default: 49223)
- Auth Key — optional authentication (see below)
- Press
Enterto save,Escto close
Dashboard Overview
The dashboard displays real-time metrics in a card-based layout:
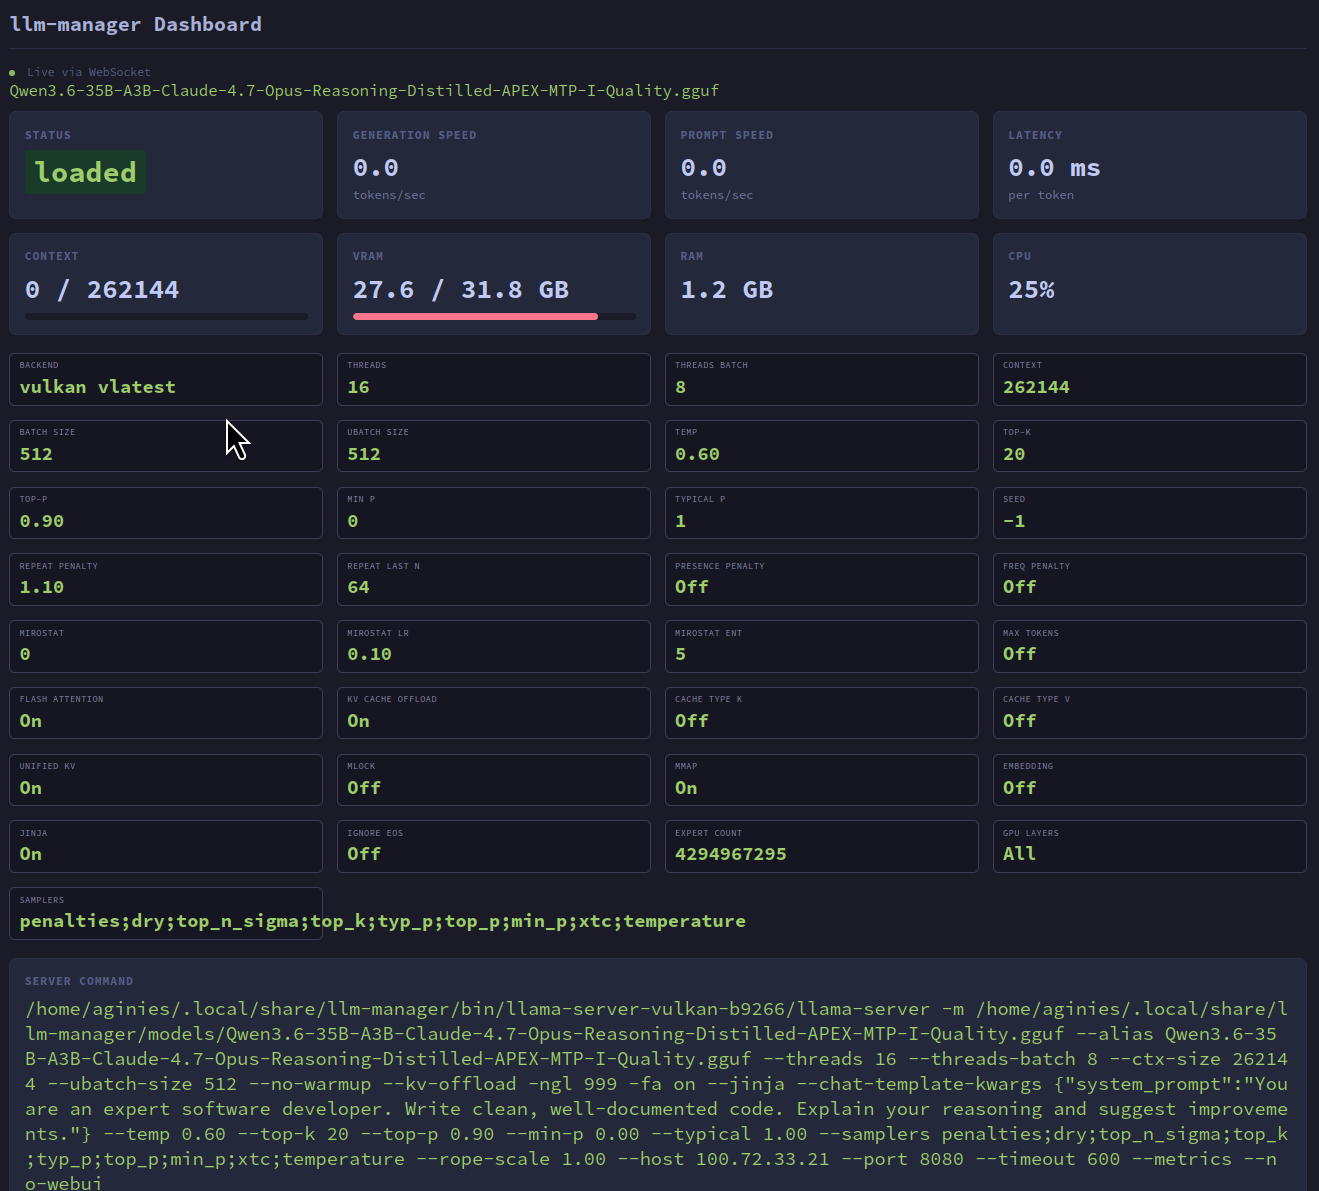
Metrics Cards
| Metric | Description |
|---|---|
| Status | Current model state (loaded / unloaded / loading) |
| Generation Speed | Tokens per second (TPS) for text generation |
| Prompt Speed | Tokens per second for prompt processing |
| Latency | Milliseconds per token |
| Tokens | Tokens generated with progress bar (decoded_tokens / max_tokens, or ‘∞’ if not configured) |
| VRAM | GPU memory used/total with color-coded progress bar (green <50%, yellow 50-80%, red >80%) |
| RAM | System memory usage |
| CPU | CPU usage percentage |
Settings Panel
Below the metrics, the dashboard shows a grid of current inference settings:
| Setting | Description |
|---|---|
| Backend & Version | llama.cpp backend and version |
| Threads / Threads Batch | CPU thread configuration |
| Context / Batch Size / Ubatch Size | Model execution parameters |
| Temperature / Top-k / Top-p / Min P / Typical P | Sampling parameters |
| Seed | Random seed for reproducibility |
| Repeat Penalty / Repeat Last N | Repetition control |
| Presence Penalty / Frequency Penalty | Advanced repetition control |
| Flash Attention / KV Cache Offload | Performance optimizations |
| Cache Type K / Cache Type V | KV cache quantization |
| Unified KV / Mlock / Mmap | Memory management |
| Expert Count / GPU Layers | Model-specific settings |
| Samplers | Sampler order string |
| Spec Type / Draft Tokens | Speculative decoding configuration |
| Yarn RoPE / Yarn Params | Context extension parameters |
| Tags | Per-model tags |
Server Command
The full llama-server command line is displayed at the bottom of the dashboard, showing the exact invocation with all parameters. This is useful for debugging and inspecting the exact configuration being used.
Configuration
To enable and configure the dashboard:
- Open the Server Settings panel (F2)
- Navigate to Dashboard and press
Enter - Configure:
- Enabled — toggle on/off
- Port — server port (default: 49223)
- Auth Key — optional authentication (see below)
- Press
Enterto save,Escto close
Authentication
When an auth key is configured, clients must include it as a query parameter:
http://localhost:49223?auth=mysecretkey
Connection Status
The dashboard shows a connection indicator at the top of the page:
- Green pulsing dot — Connected via WebSocket
- Red dot — Disconnected (auto-reconnects every 2 seconds)
Architecture
The dashboard server is built with axum and tokio. It:
- Creates a
broadcast::channel(64)for metrics distribution - Spawns the server on the configured port
- Each metrics update is sent to the broadcast channel
- WebSocket clients subscribe and receive real-time updates
- The HTML dashboard (embedded in the binary) connects via WebSocket and renders the metrics
The server is started/stopped automatically when you toggle the Dashboard setting in Server Settings.